
Page 52 - CUA 2020_Onco_Prostate
P. 52
2020 CUA Abstracts
MP-4.10. Table 1. Odds ratio of free hand TRUS biopsy prostate-specific antigen (PSA), quantitative % Gleason 4/5 on biopsy, and
perineural invasion. The ML model achieved an area-under-curve (AUC)
detecting CS cancer over template guided systematic of 0.771 vs. 0.674 for the MSKCC nomogram (p=0.006). Setting sensitivity
biopsy after controlling for age, race, PSA, DRE, and at 0.80, the ML model achieved higher accuracy (0.67 vs. 0.60), specific-
family history of PCa ity (0.55 vs. 0.43), positive predictive value (0.62 vs. 0.56), and negative
Odds ratio 95% CI p predictive value (0.75 vs. 0.70) compared to the MSKCC nomogram. The
All patients 0.99 0.71–1.38 0.958 ML model generates feature weights on a case-by-case basis to explain
how each feature contributes to the final prediction (Table 1).
Biopsy-naive 0.79 0.51–1.22 0.291 Conclusions: Our preliminary ML model performed favorably compared
Prior negative 0.64 0.21–1.75 0.403 to our reference standard. Further studies with larger datasets are needed
to validate this methodology.
MP-4.11 MP-4.12
Explainable AI: Using machine learning to identify risk factors
and explain improved predictions of extra-prostatic extension Preoperative neutrophil to lymphocyte ratio predicts adverse
in pre-prostatectomy patients pathology at radical prostatectomy 1 1
Kush M. Joshi , Arnon Lavi , Ray S. Jia , David Z. Guy , Danielle A.
1
2
Jethro C.C. Kwong , Simona Minotti , Adrian Cozma , Ashkan Javidan , Starcevic , Sophia Moralis Frost , Natan Veinberg , Shiva M. Nair , L.K.
1
2,3
1
4
1
2
1
1
5
5
2
5
Amna Ali , Munir A. Jamal , Thomas Short , Frank F. Papanikolaou , John Joseph Chin 2
R. Srigley , Andrew H. Feifer 2,5 1
6
1 Faculty of Medicine, University of Toronto, Toronto, ON, Canada; Institute Schulich School of Medicine & Dentistry, Western University, London,
2
2
for Better Health, Trillium Health Partners, Mississauga, ON, ON, Canada; Urology Division, Department of Surgery, Schulich School
of Medicine and Dentistry, Western University, London, ON, Canada
Canada; Department of Statistics and Quantitative Methods, University Introduction: Neutrophil to lymphocyte ratio (NLR) has been reported
3
4
of Milano-Bicocca, Milano, Italy; Department of Radiation Oncology, to have prognostic significance for a variety of malignancies, including
5
University of Toronto, Toronto, ON, Canada; Department of Surgery, urological cancers. We set to define the prognostic value of NLR before
6
University of Toronto, Toronto, ON, Canada; Department of Laboratory radical retropubic prostatectomy (RRP).
Medicine and Pathobiology, University of Toronto, Toronto, ON, Canada Methods: We analyzed our retrospective RRP database to assess the pre-
Introduction: Current nomogram predictions of extra-prostatic extension dictive value of NLR. A cutoff of 3.5 was used based on previous reports.
(EPE) in pre-prostatectomy patients use logistic regression on a limited A logistic regression was preformed to evaluate the correlation between
set of covariates. While incorporating machine learning (ML) methodol- NLR and adverse pathological characteristics at RRP.
ogy may improve predictive accuracy, their “black-box models” limit Results: Complete data was available in 698 patients. Correlation between
interpretability in the clinical setting. We used explainable ML to identify NLR and common adverse RRP pathology parameters were assessed
additional pre-prostatectomy risk factors of EPE and explain how each (Table 1). Higher NLR was found to predict upgrading at RRP, extra-
feature may enhance predictive capacity compared to current tools. prostatic extension (EPE), and seminal vesical involvement (SVI) both on
Methods: Our prostatectomy database includes 351 patients with 21 univariable analysis (odds ratios [OR] 1.94, p=0.002; OR 1.9, p<0.001;
covariates (known as features in ML terminology). We used random forest OR 2.76, p<0.0001, respectively) and multivariable analysis adjusted
classification, which is an ensemble ML method composed of a collec- for established preoperative prognostic parameters (OR 1.74, p=0.027;
tion of decision trees. Feature selection was determined by Gini impurity OR 2.41, p<0.0001; OR 3.95, p<0.0001, respectively). Presence of posi-
and permutation importance. Hyperparameter tuning included number tive lymph nodes and positive surgical margins were not correlated with
and depth of each tree. Ten-fold cross-validation was used for model high NLR.
development, tuning, and validation. The reference standard used for Conclusions: In this current cohort, higher NLR predicts upgrading at RRP,
comparison was the Memorial Sloan Kettering Cancer Center (MSKCC) EPE, and SVI and may be a commonly available prognostic indicator for
pre-prostatectomy nomogram. poorer outcome in patients undergoing radical prostatectomy.
Results: A total of 167/351 (47.6%) patients had EPE. The top six features
were: % tissue involvement in overall biopsy, % involvement of most
involved core, % involvement of highest Gleason core, pre-prostatectomy
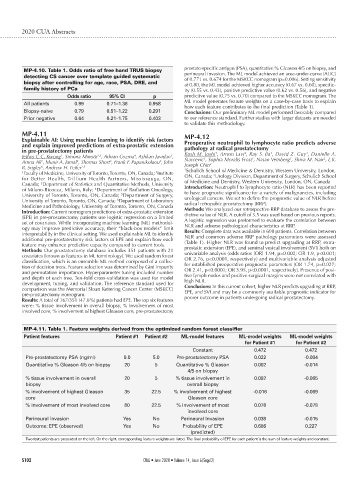
MP-4.11. Table 1. Feature weights derived from the optimized random forest classifier
Patient features Patient #1 Patient #2 ML-model features ML-model weights ML-model weights
for Patient #1 for Patient #2
Constant 0.472 0.472
Pre-prostatectomy PSA (ng/ml) 9.0 5.0 Pre-prostatectomy PSA 0.022 -0.004
Quantitative % Gleason 4/5 on biopsy 20 5 Quantitative % Gleason 0.002 -0.014
4/5 on biopsy
% tissue involvement in overall 20 5 % tissue involvement in 0.092 -0.065
biopsy overall biopsy
% involvement of highest Gleason 35 22.5 % involvement of highest -0.016 -0.069
core Gleason core
% involvement of most involved core 80 22.5 % involvement of most 0.076 -0.078
involved core
Perineural invasion Yes No Perineural Invasion 0.038 -0.015
Outcome: EPE (observed) Yes No Probability of EPE 0.686 0.227
(predicted)
Two test patients are presented on the left. On the right, corresponding feature weights are listed. The final probability of EPE for each patient is the sum of feature weights and constant.
S102 CUAJ • June 2020 • Volume 14, Issue 6(Suppl2)